


LightningChart - 数据可视化工具包
LightningChart已经更新到v.8.4!
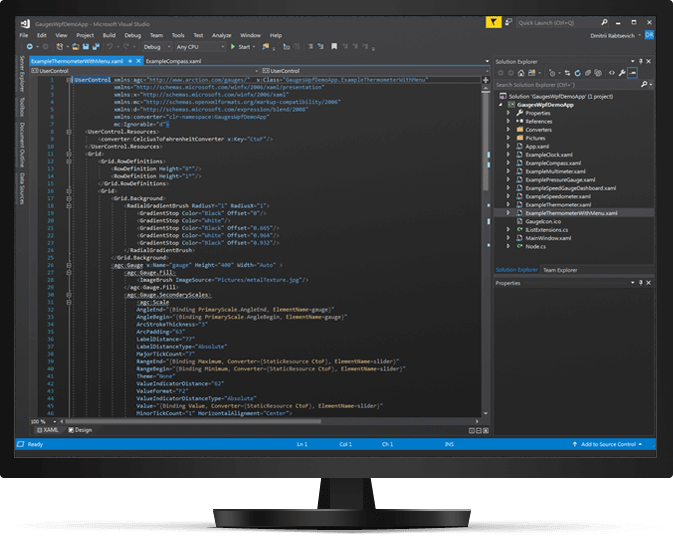
LightningChart是一款微软Visual Studio 插件,也是2D和3D数据可视化工具包,Windows Forms和WPF。它被广泛应用于高难度行业,如: 医疗、科研、工程、石油和天然气、航天与国防、金融与贸易等。
为需要高速数据采集与呈现实时数据高速软件而设计。图形采用的CPU负载节省技术,为应用程序提供了较好性能。LightningChart发挥了GPU高速性能的很大效应,能够实时呈现10亿以上的海量数据点数据。
LightningChart拥有的二维XY图表、三维XYZ图表、坐标图、3D饼图、地理地图和G.I.S、信号工具,体数据渲染。
市场上高能
LightningChart有GPU加速,并且性能可用于实时显示海量数据— 10亿个数据点。
它是为高速软件而开发,可处理实时数据采集和表示,并利用CPU和内存资源。这为您的应用程序提供了较好性能,这着:
-
实时监控无闪烁或延迟
-
高分辨率数据集
-
互动性
-
利用机器资源
-
能够使用较旧的机器硬件渲染数据,并保持上述优势
对于苛刻的开发人员
LightningChart广泛的2D ,3D,Polar,Smith,3D饼图,地理地图和GIS图表以及适用于科学,工程,医学,航空,贸易,能源和领域的体绘制功能。
LightningChart还为不同行业的.NET开发人员提供了可自定义的工具和性。
产品
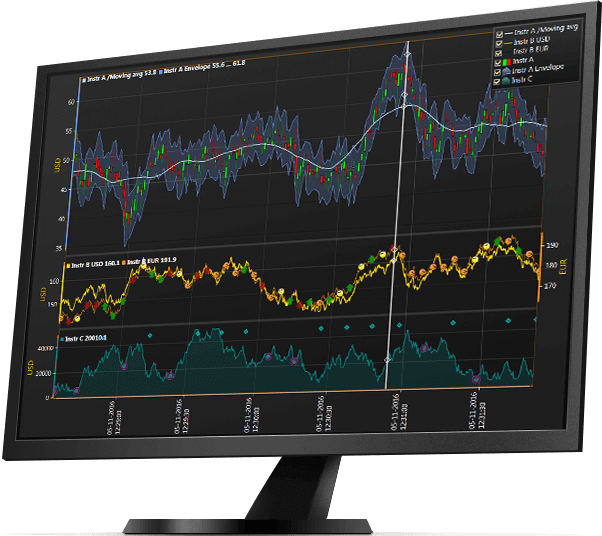
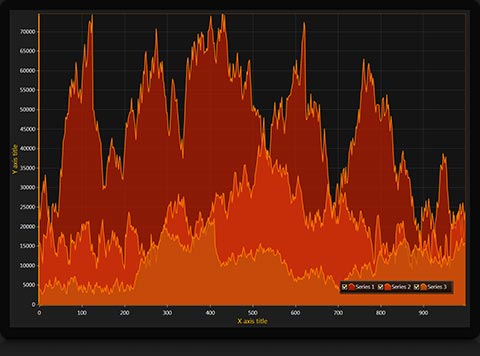
二维XY图表:
-
系列类型:抽样数据(离散信号)、点线、任意形式的点线、面积、高低、多边形、股票系列(蜡烛图)、条、带、恒定线、密集网格图和线集合图。
-
不同的X轴实时监控滚动模式:滚动、扫描、步进、以触发不同的示波器风格
-
强度系列能够渲染多边形内部,地图区域或选定模板内部
-
热图(Heatmap)带有轮廓线,线框,轮廓标
-
持续渲染层、多图例和轴刻度分隔
-
调整日期范围来剔除不的信息,例如周末的非交易日
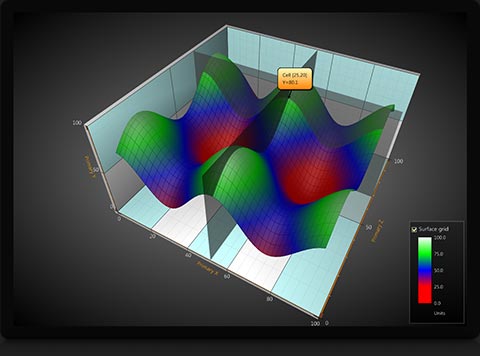
三维XYZ图表:
-
系列类型:曲面网格图、瀑布图、多边形、矩形平面、网格模型、点线、条形图和饼图
-
预定义设置,透视和正交3D摄像机,多种灯光和阴影选项。
-
导入 .obj 格式的三维模型
-
4096x4096 分辨力的巨大曲面图(取决于可用内存)
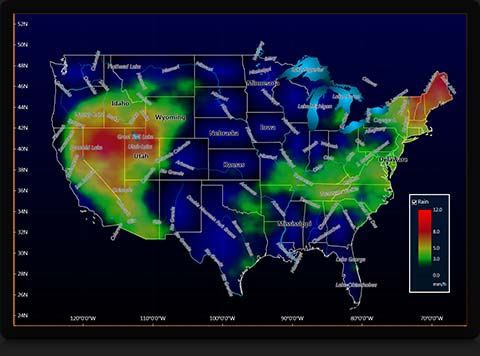
地理地图和G.I.S:
-
矢量地图
-
在线展开地图:街道地图、卫星图和WeatherBug天气数据
-
地图,各大洲地图和区域地图
-
几十个地图:洲地图、指定区域地图
-
多层次:陆地、湖泊、河流、道路、城市等等
-
从ESRI形状文件数据导入地图
坐标视图:
-
多幅度和角度坐标轴
-
扇形区
-
标签
-
缩放和平移
-
调色版着色点线系列

史密斯视图:
-
系列样式: 点线
-
标准化尺度

信号工具:信号读取器,信号发生器,音频输入,音频输出,频谱计算器
体数据渲染
-
为颜色通道设定独立线性传送功能
-
根据体素亮度为颜色通道调整体积阈值
-
动态修改体素范围
-
手动或自动采纳体数据的采样率
-
为体积渲染射线功能提供三种可互换的选项

信息:
-
鼠标交互,触屏,自定义鼠标交互扩展
-
光标注释,调色版着色数据,自定义组件
-
在选定的系列类型中,通过NaN或指定的分隔值断开数据
-
使用数字、时间、日期、对数、地理坐标系和自定义轴刻度
-
(GCS)和自定义四刻度的五星级的技术和数百个图表示例
渲染技术:
-
DirectX 11 与 DirectX 9
-
系统中WARP自动渲染软件,图形硬件和虚拟机
-
图表未使用或隐藏时,可以停止渲染以节省GPU资源
-
字体选择
-
HiDPI缩放
-
运行于32位和64位系统模式
-
抗锯齿选项
LightningChart V8.4版在如下功能上做了改进:
1. 边距
边距在视图中可见:新版本在3D和3D饼图中添加了边距,并且在坐标图进行了更改。
边距中的裁剪视图可见Clipping via margins in all views.
2. 缩放功能
ZoomPanOptions选项中新添加了的ZoomPadding功能:ZoomPadding可以在3D,3D饼图,坐标和里找到。
3D中新加入了ZoomToDataAndLabelsArea
坐标图中缩放功能的改进
了3D,3D饼图,坐标中调用缩放的方法
3. Legend box的自动定位
实现了视图在Legend box的自动定位
4. 正投影
新版本更新了正投影,使用上不再基于维度的变换,比以前
5. 相机oriientation与rotation系统
新添了相机orientation模式,并在方向定义上做了改进。
6. 3D坐标空间转换器
添加了3D转换器类别,可以在Cartesian 3D和圆柱3D坐标之间转换
7. PointLineSeries 3D性能改进
在显示大量数据时(百万数据点)增加了单点着色的选项
现在可以Z的顺序在3D视图里绘制2D形状点
新的SeriesPointCompactColored 3D收录在WPF绑定版本和SeriesPointpact 3D结构中
8. Debugging功能
根据自动过滤消息的ChartMessge
9. Demo应用程序的变更
添加了新示例
10. 用法改进
技术资料API的改进
改进了自动annotation size计算
改进了与病毒软件的兼容性
改进了监视器DPI窗口大小
LightningChart提供以下信息工具:
信号读取器
信号读取器生成时数据流,能以不同格式读取信号文件:WAV(PCM),sid(生物信号文件),ssd(LightningChart Ultimate 应用程序演示示例数据格式),播放可以使用循环选项将自动启动。
音频输入
基于DirectSound声卡输入(例如:使用麦克风)捕获实时采集数据流。数据可以通过音频输出,或者用户自己提供数据。
信号发生器
信号发生器是多功能信号生成组件,将不同的波形类型组合成单个实时输出信号。内置用户界面,或者用户自己设置。
频谱计算
使用傅里叶变换(FFT)算法在时域和频域之间转换数据。适于计算FFT转换和采集信号数据的功率谱。
音频输出
基于DirecSound从声卡线路输出(例如:使用扬声器)播放实时数据流。
数据可以从SignalGenerator,SignalReader,AudioInput中获取或者通过数据源获取。
兼容性要求
32位或64位操作系统,或Windows Server 2008 R2以上版本。
DirectX9.0c(shader model 3)图形适配器,或DirectX11兼容操作系统
Visual Studio 2010-2019版本
.net宽肩 v.4.0以上版本
【英文介绍】
Key features
XY Graph view
Draws huge amounts of measured data as graphs in real-time, very smoothly, up to hundreds of millions of new data points / sec.
High refresh rate even with heavy load
Renders vast data sets instantly
Series types: sampled data (discrete signal), point-line, freeform point-line, areas, high-low, polygon, stock series (candle-stick), bar, band, constant line, intensity grid, intensity mesh
Geographic maps can be combined with other XY view series and objects.
Intensity series are perfect e.g. for environmental data over maps and thermal imaging. Can be rendered inside selected polygons or map regions.
Zoom, pan and rotate operations
Built-in series tracking cursors
Series and chart event marker indicators
Unlimited X axes/chart, vertical position adjust
Unlimited Y axes/chart: stacked or layered
Different X-axis real-time monitoring scrolling modes: Scrolling, sweeping, stepping, oscilloscope style level triggered
Automatic scale fitting, grids and divisions
Fast scale setting with mouse, configurable zoom and pan buttons
Logarithmic axis scales, advanced features for minimal values between 0...1
Annotations for labeling and tagging any information, and to be used as a general-purpose vector drawing objects. Move, scale and rotate by mouse.
3D XYZ View
Real 3D visualization
Series types: point-line, bar, surface mesh, surface grid, waterfall, mesh models
Gigantic surface sizes of over 2000x2000.
Height/Toned/Point coloring for surfaces and waterfall
Contour lines and wireframing for surfaces and waterfall
Many lighting and shading options
3D models can be imported from CAD and modeling applications, as X-file
Perspective and orthographic 3D camera, with pre-defined setups
Zoom, pan and rotate operations
Logarithmic axis scales, advanced features for minimal values between 0...1
Geographic maps & G.I.S.
World, continents, specific areas
Dozens of maps
Multi-layer: land, lakes, rivers, roads, cities etc.
High/Mid/Low resolutions
Map import from ESRI shape file data
On-the-fly silent map layer replace/import for frequently updated SHP data
Polygon and vector based objects
Background image setting from satellite photo
Fast rendering
Mouse interactive objects
Several fill and style options: individual or common layer based
Many coordinate formats
Border points and other data can be accessed from objects
Digital elevation model (DEM) data can be presented with IntensityGrid (ViewXY) or IntensityGrid3D (View3D) series, with contour lines
3D models can placed in View3D
Polar view
Series types: area, point-line
Several amplitude and angle axes
Sectors
Markers
3D pies / donuts
Freely rotatable 3D visualization
Pie and donut styles
Dimension adjustment
Exploded slices
Mouse interactive
Predefined lighting schemes
General
Comprehensive user interface customization: Fonts, alpha colors, line styles, point styles, bitmaps, fills, blinking effects, anti-aliased lines
Scrollbars with 64-bit value range
Overlay labels for general-purpose text displaying and frame drawing
Print with print preview
Copy to clipboard and export as BMP/JPG/PNG/GIF/TIFF files. XY graph also in WMF, EMF and SVG.
Series data export to MS Excel as CSV
Full 64-bit support. Utilizes over 2 GB memory (in 64-bit systems).
Available as .NET2 and .NET4 builds
Royalty-free distribution


- 2026-06-25
- 2026-06-25
- 2026-06-24
- 2026-06-22
- 2026-06-22
- 2026-06-18

- 2026-06-30
- 2026-06-22
- 2026-06-22
- 2026-06-22
- 2026-06-11
- 2026-06-11