QuantiScan - 凝胶扫描分析软件
注:特此通知,BIOSOFT将于2022年12月31日停止交易。
电子邮件地址info@biosoft.com将在该日期后的2年内继续有效,以便向软件的注册用户提供程序激活代码和少量技术支持。
QuantiScan是一款凝胶扫描分析软件。QuantiScan还可以帮你分析,扫描多种多样的材料成分。可以将普通的办公扫描仪转换为功能的显像密度计,用于分析凝胶,污点和薄层层析板等。
用于Windows的QuantiScan具有复杂的光密度计的功能,它能够分析多种材料,聚丙烯酰胺和琼脂糖凝胶,放射自显影图,TLC板等。该程序将直接从TWAIN兼容扫描仪以及大多数BMP,JPG或未压缩的TIF文件接受图像进行分析。对于质量合理的泳道凝胶,分析是自动化的,可实现很高的数据通量。使用Quantiscan的手动模式几何可以分析类型的图像。
数字,图形和图像输出可以打印为报告,也可以另存为文件或复制到剪贴板。可以将光密度分析分布图的X,Y坐标输出到选项卡式表格中,以便在演示图形软件(例如Biosoft的FigSys)中进行重新绘图。有单个的模块,用于分析不连续的印迹,也可以通过自动或手动印迹检测进行操作。
泳道分析模式
凝胶具有复杂的泳道处理和分析功能。可以手动创建宽度的车道,也可以使用自动车道检测模式创建。还有一种功能可以四栋按固定间隔设置车道,以用于具有预先配置的规则车道阵列的板。泳道可以倾斜或弯曲,以允许出现凝胶缺陷。可以复制泳道边界,并使用光标键将副本地移动到的位置,以进行比较。泳道在其图像和光密度测定图上均可以表有编号。自动背景减法有六个选项:Minimum value,内插 Minimum value,谷值,边沿,多项式和手动。用户选择的图像区域可以显示为3-D密度图,可以将其打印,保存或复制到剪切板。
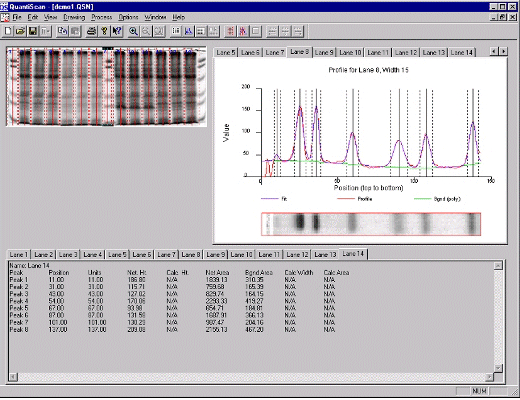
定义车道后,将自动绘制其光密度分布图。然后可以通过在轮廓上手动记峰的中心和边缘来指定峰,也可以使用复杂的峰搜索例程自动定峰值。在的情况下,可以执行高斯峰的自动拟合。这种自动拟合使用l east squares Minimizes 技术将峰的序列和多项式背景拟合到给定的轮廓。当前所选车道的图像在车道光密度测定曲线下方水平放置。光标控制的垂直线穿过轮廓和车道图像,有助于用户检查峰。可以添加标准车道的图像和配置文件,以便与个车道进行比较。可以调整他们的对齐方式,以帮助进行的并排比较。峰面积是使用Simpson规则通过积分计算的,如果使用了自动拟合选项,则也会自动计算拟合峰的面积。可以添加标准车道的图像和配置文件,以便与个车道进行比较。可以调整他们的对齐方式,以帮助进行的并排比较。
可以定义标准蛋白质的泳道进行校准,以自动计算分子量。也可以使用已知的的标准溶液(例如测定试剂盒提供溶液)进行校准(输入起始行的位置,其摩尔重量因素和容积前沿的位置,即可自动计算出未知数)。可以保存标准泳道的参数以进行板间比较。可以导出校准曲线图及其拟合的坐标。生成峰参数的报告,位置,宽度。
印迹分析模式
QuantiScan提供了一种单个的模式来分许离散印迹。印迹可以自动检测或手动定义。他们的数量,位置,,面积和光密度体积会自动报告。有用于自动分析规则排列的印迹的模块。自动背景减法是选项。可以基于标准印迹的光密度体积进行校准,这可以将印迹模式用于测定。
【英文介绍】
QuantiScan for Windows has similar functionality to sophisticated densitometers but at a fraction of the cost. It is able to analyze a wide variety of material including polyacrylamide and agarose gels, autoradiograms, TLC plates, etc. The program will accept images for analysis directly from any TWAIN compliant scanner as well as most BMP, JPG or uncompressed TIF files. For laned gels of reasonable quality, the analysis is highly automated, allowing extremely high throughput of data. Almost any type of image can be analyzed with the manual modes of Quantiscan. Images can be pre-processed in a variety of ways within QuantiScan including crop, flip, invert, scroll and zoom.

Numeric, graphical and image output can be printed as reports and can also be saved as files or copied to the clipboard. The X,Y coordinates of densitometric profiles can output into a tabbed table for re-plotting in presentation graphics software such as Biosoft's FigSys. There is a separate module for analysis of discrete blots which can also be operated with automatic or manual blot detection.
Lane Analysis Mode
There is sophisticated lane processing and analysis for gels. Lanes of any width can be created manually or by using the unique automatic lane detection mode. There is also a facility to automatically set lanes at regular intervals for use with plates that have a preconfigured regular lane array. Lanes can be skewed or curved to allow for gel imperfections. Lane boundaries can be copied and the copies moved precisely into position with the cursor keys, for exact comparisons. Each lane can be labelled with an unique number both on its image and its densitometric profile plot. There are six options for automatic background subtraction: Minimum, Interpolated minimum, Valley, Edge, Polynomial and Manual. User-selected areas of images can be displayed as 3-D density maps which can be printed, saved or copied to the clipboard.
Once a lane has been defined, its densitometric profile plot is automatically drawn. Peaks can then be specified on the profile either manually by marking their center and edges, or automatically using a sophisticated peak search routine. Where appropriate, automatic fitting of Gaussian peaks can be performed. This automatic fitting uses a least-squares minimization technique to fit a sequence of peaks and a polynomial background to the given profile. The image of the currently-selected lane is shown laid-out horizontally under the lane densitometry profile. A cursor-controlled vertical line going across the profile and the lane image aids user examination of the peaks. The image and profile of a standard lane can be added for comparison with the first. Their alignment can be adjusted to aid accurate side-by-side comparisons. Peak areas are calculated by integration using Simpson's rule and, if the automatic fitting option has been used, the area of the fitted peak is also automatically calculated.
Calibration to a lane containing standard proteins may be made for automatic calculation of molecular weights. Calibration can also be made with a known standard solution such as those supplied with assay kits (just enter the position of its start line, its mol. wt. factor and the position of the solvent front, to give automatic calculation of mol. wts of unknowns). Parameters of any standard lane can be saved for between-plate comparisons. Calibration curve graphs and their fitted coordinates can be exported. Reports are generated for all peak parameters, including position, height, width, background and net area of peaks and, together with the graphical results, these can be printed, saved to disk or copied to the clipboard for transfer to other programs.
Blot Analysis Mode
QuantiScan offers a separate mode to analyze discrete blots. The blots can be automatically detected or manually defined. Their number, position, height, area and densitometric volume are automatically reported. There is a special module for automatic analysis of regularly arrayed blots. Automatic background subtraction is an option. Calibration, based on densitometric volume of standard blots can be done and this allows blot mode to be used for assays.
- 2026-01-20
- 2026-01-16
- 2026-01-12
- 2026-01-12
- 2026-01-09
- 2026-01-05
- 2026-01-28
- 2026-01-26
- 2026-01-26
- 2026-01-16
- 2026-01-14
- 2026-01-12


