


Igpet - 火成岩岩石化学处理软件
Igpet为火成岩岩石学的教学和研究提供了工具,允许用户开发自己的数据文件和使用图形长须发现和解释的地球化学变化模式。Igpet是为火成岩岩石学数据分析和图形包。有Windows(XP或Vista)和Mac版本(系统X)。

-
Harker,Fenner,Discrimination,CMAS,SPIDER,REE和Pearce元素比例图
-
线性回归、双曲线混合和AFC建模
-
CIPW规范和岩浆混合计算
-
使用剪贴板将数据传输到电子表格或图形以绘制程序
-
PDF输出
Igpet绘制了大多数类型的岩石学图,Harker、Fenner、三角图形和测井图。计算器(-/*)、Log、平方根、ppm和软骨石函数。用途的图表,例如Irvine和Baragar(1971)岩石分类方案,存储在易于扩展的控制文件中。CMAS预测O-Hara、Walke、Grove、Baker和Eggle等等。蜘蛛图REES、Wood、Thompson、SUN、McDonough等。
Igpet提供了几个数据集,low pressure cotectic数据、moderate pressure cotectic数据、MORB glasses以及来自中美洲火山的calc-alkaline rocks。
Igpet不断更新,以适应新的操作系统和新的和功能。
-
绘制误差线绘图
-
Igpet具有图例功能
-
变量窗口中的方程式解析器
-
Ce*,Eu*,Nb*添加到“参数”功能
-
符号数量加倍
-
单击按钮切换X和Y轴变量
-
Macintosh版的Igpet现在与OS X兼容
-
Igpet的Windows版本已经使用XoJo重写,因此它不再被防病毒程序标记为“损坏”程序。另外,矢量图形输出现在保存为PDF而不是WMF文件。Mac版的IgPet现在经过公证,可以在Catalina操作系统上使用。
英文简介:
Igpet provides tools for teaching and research in Igneous Petrology , allowing users to develop their own data files and to use graphics routines to discover and interpret patterns of geochemical variation.
-
Harker , Fenner,Discrimination, CMAS, SPIDER ,REE and Pearce element ratio plots
-
Linear regression , hyperbolic mixing and AFC modeling
-
CIPW norms and least-squares fractionation and magma mixing calculation
-
Transfer data to spreadsheets or graphics to draw programs using the clipboard
-
Publication quality output
Igpet 3/4 draw most types of petrologic diagrams , including Harker , Fenner, triangular and plots . A calaulator includes (-/*) , Log, square , square root , ppm and chondrite functions . Special purpose diagrams, e. g. the Irvine and Baragar (1971) rock classification scheme , are stored in control files that can be expanded easily . CMAS projections include o-Hara , Walker , Grove, Baker and Eggler etc. Spider diagrams include REES , Wood, Thompson , Sun and McDonough etc.

Igpet3/4 comes with several data sets , including low pressure cotectic data , moderate pressure cotectic data , MORB glasses ,and several suites of calc-alkaline rocks from Central American volcanoes.
IGPET PLOTS
Igpet provides tools for teaching and research in Igneous Petrology , allowing users to develop their own data files and to use graphics routines to discover and interpret patterns of geochemical variation.
Igpet example charts
Regression lines are sometimes informative and colored backgrounds can be either soothing or distracting, depending on one's mood. A toggle button swithches background color on and off.
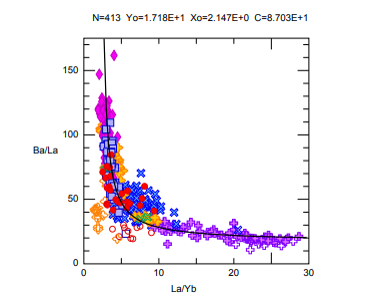
One of Igpet's functions is fitting a regression hyperbola(a mixing curve)in ratio versus ratio plots. Reasonable fits, like the one above, indicate that mixing is not ruled out. The line can be toggled on/off by the NB(nota bene)button.

Every gechemist likes spider plots, perhaps because the Log scale of the Y axis hides a lot of noise and failure to fit. However this data set is high quality and has limited range of variation.
This spiderplot for just Cerro Negro was made from the same datafile as the La/Yb versus Ba/La diagram above it. Igpet's SubSelect menu is a powerful tool for filtering large datafiles to get to what you want. It obviates the need for numerous small datafiles.
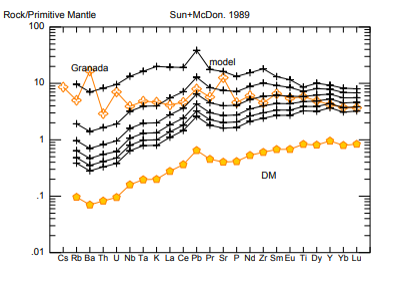
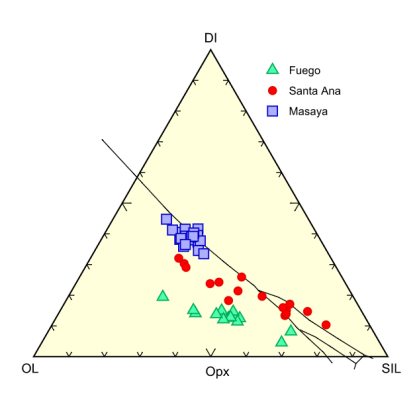
One cannot make the Granada lava by melting just a depleted mantle. Other components are needed. The strongest part of Igpet is multi-element modeling based on Spider plots. Models available include batch melting, aggregated fractional melting, AFC, FC, etc. The models(+'s) remain in memory and will plot in XY plots.
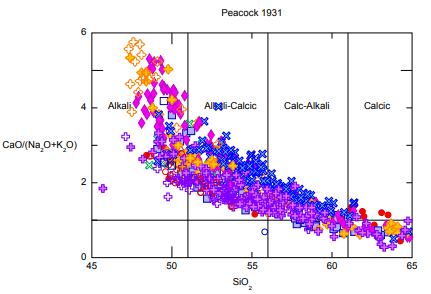
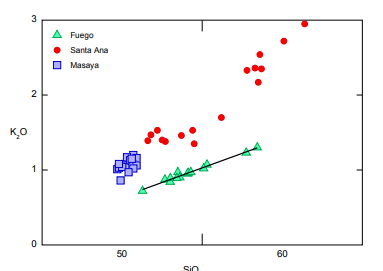
The origin of the term, calc-alkaline. Where the data array crosses the horizontal line at 1.0 identidies the field. The data here, the Central American volcanic front, define a calc-alkaline assemblage. Peacock's original diagram was different but this easier to plot.

The distribution of SiO2 in Central American volcanics is not normal. The histogram on the left has sub-boxes for all the different groups that have different symbols. It also has some statistics. The same data make a more publication friendly image when plotted using the same sysbol for all function(using#32, a grey cross). The fitted normal curve is obviously not a “good”fit.
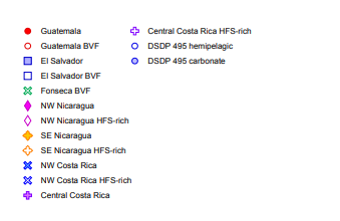
Igpet generates a separate legend for diagrams/files with too many symbols, like the Central American volcanic front file diaplayed in the previous six diagrams.
This set of Harker diagrams for Telica volcano was made with eight preset rectangles. Not a very attractive diagram because the X-axis is too broad. It is included here just to show an Igpet capability. The X and Y axes can be adjusted in the file Harker 2. txt.

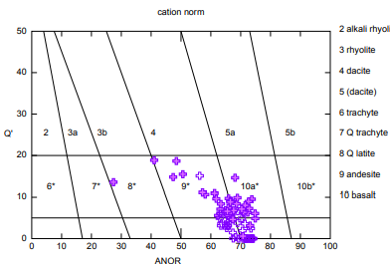
Many tectonic identification and rock nomenclature plots are included in Igpet. Note the funny item “NM100”. This means that the analyses were normalized to prior to plotting, AS SPECIFIED BY THE CREATORS OF THE DIAGRAM! The line of text just above the diagram is easily removed using the NB on/off toggle button. Data are from Irazú volcano in Costa Rica.

According to this method, eveb the basalts at Irazú are mostly trachyandesites.

This diagram works better and accurately finds the basalts at Irazú.
The IUGS “offcial”classification names the rocks at Irazú as the Costa Rican geologists do and findes mostly basalts and andesites.

The Central America data are shifted to lower Nb contents and do NOT plot in the fields of Oceanic basalts. This is one way to show the well-known Nb depletion in arc magmas. Many of the open symbols for Nicaragua plot in the Oceanic field and wer recognized as odd many years ago when their robust TiO2 contents earned them the sobriqust“High Ti”basalts. This was a misnomer because the TiO2 contents were only high relative to the greatly depleted magmas found at arcs. These are arc magmas that are mildly enriched Ba, Sr and Pb and have a bit of 10Be. They lack HFS depletion. What are they doing in Nicaragua?
THe yellow pentagon id a DM(depleted mantle)estimate.
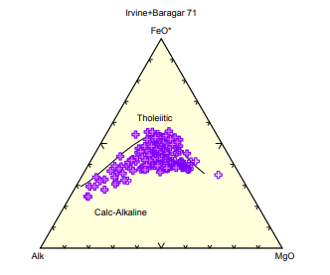
The Costa Rican lavas, as shown above, are indeed Calc-alkaline.

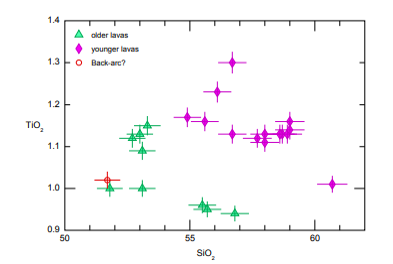
Many volcanoes have distinctly different magmas erupting. This example is Telica in Nicaragua. I changed the font to Futura just to show that the fonts can be changed. All the other diagrams use Arial.
Igpet allows error bars. For each element you add a column called“error”right after the column of element values(or oxide or isotope ratio etc). Put the errors in this column and you get a plot like the one above. The errors shown here for Boqueron volcano are eatimates. SiO2 is 1.0%, so a value of 53 gets an error of 0.5.3. For TiO2 the error estimate was 2.0%.
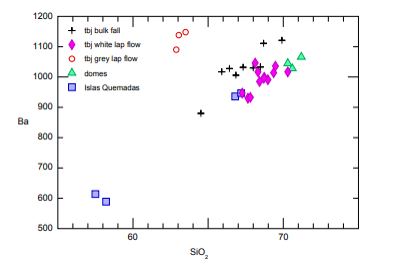
It is always a good idea to separate identifiable subnits using symbols. The pyroclasti flow from the Ilopange caldera that erupted about 400 AD had two populations of pumice lapilli, white and grey. The fall deposit from the eruption, called Tierrs Blanca Joven(tbj)was the result of a hydromagmatic eruption that turned whatever pumice was present into fine particles. Analyses of bulk fall deposit lie between the two populations of pumice lapilli.

Finally, here is one of my favorite ideas, plotting geochemistry against physical or tectonic parameters. This is Ba/La against distance along the volcanic front of Central America. It needs to be spiffed up in Ai.
Quadratic and cubic polynomial regressions are now included in Igpet(June 2014). In the case below there is no logical reason to fit the data with a cubic regression. I include this plot just to make the point that having this capabilit and using it wisely require statistical knowledge and understanding of geochemical modeling that is not included in Igpet. In other words, dont't blindly do stuff!


- 2026-07-29
- 2026-07-28
- 2026-07-26
- 2026-07-24
- 2026-07-23
- 2026-07-21

- 2026-07-30
- 2026-07-29
- 2026-07-29
- 2026-07-29
- 2026-07-29
- 2026-07-29